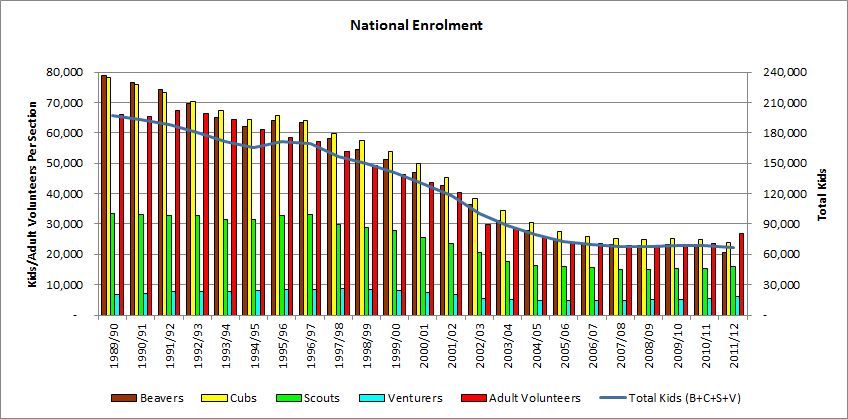
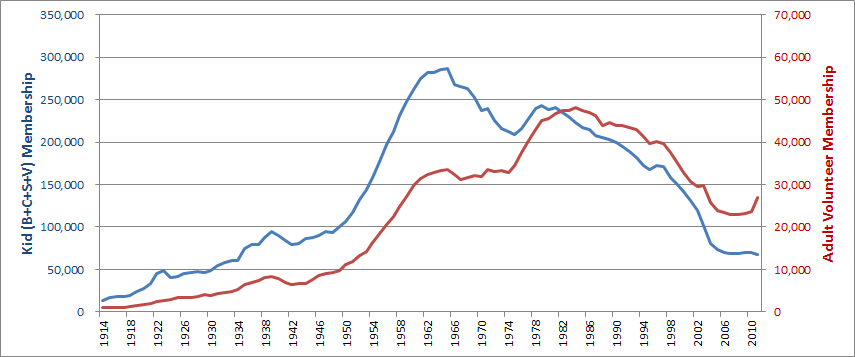
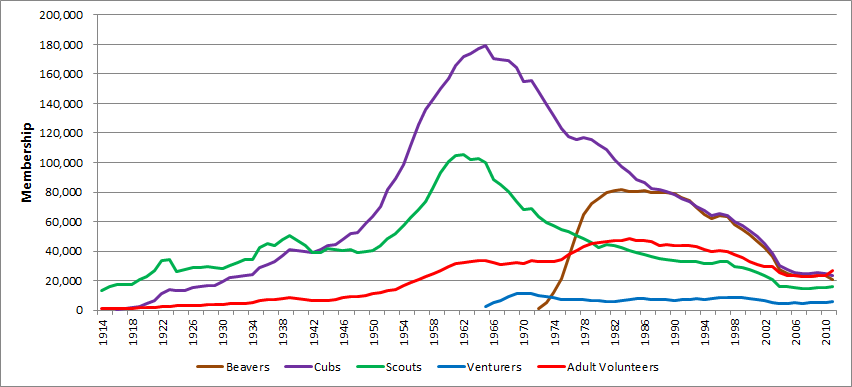
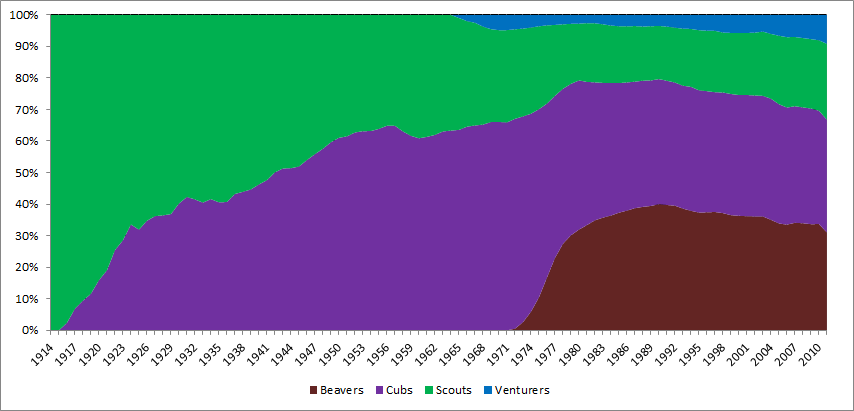
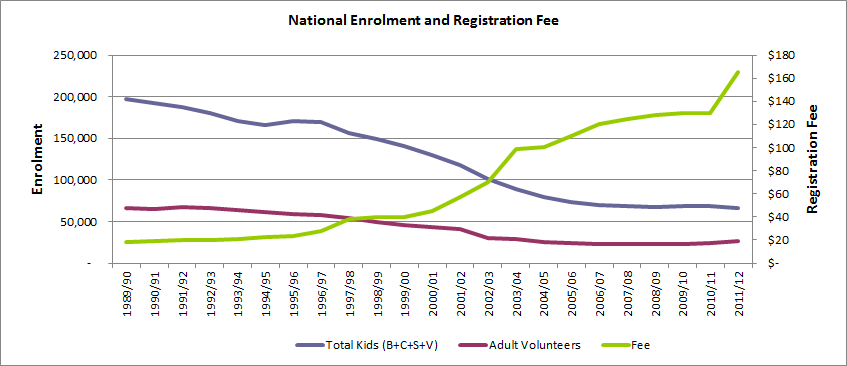
The following was originally based on data archived at the Scouts Eh! website. Note that the year is the Scouting year. So 2004 means the September 2004 - August 2005 Scouting year. This figure would appear in the 2005 annual report. For clarity, figures for Rovers, ScoutsAbout, Extreme Scouting are not shown as ScoutsAbout is just a day care service and the others only amount to 0.01% of the total youth in the program. Thus the total kids only includes Beavers, Cubs, Scouts, and Venturers.
| Year | Beavers | Cubs | Scouts | Venturers | Total Kids | Rovers | Adults | Fee | Regn Change | Kid Fee Change | ||
|---|---|---|---|---|---|---|---|---|---|---|---|---|
| Kids | Adults | Kids | Adults | |||||||||
| 2012 | $165.00 | $0.00 | ||||||||||
| 2011 | 20,622 | 23,795 | 16,014 | 6,107 | 66,538 | 1,104 | 26,873 | $165.00 | $0.00 | -3.57% | 13.52% | 26.92% |
| 2010 | 23,248 | 24,801 | 15,407 | 5,543 | 68,999 | 897 | 23,672 | $130.00 | $130.00 | -0.12% | 1.68% | 0.00% |
| 2009 | 23,251 | 25,334 | 15,205 | 5,295 | 69,085 | 794 | 23,280 | $130.00 | $130.00 | 2.26% | 1.05% | 1.56% |
| 2008 | 22,931 | 24,806 | 14,867 | 4,952 | 67,556 | 703 | 23,039 | $128.00 | $128.00 | -0.69% | 0.83% | 2.40% |
| 2007 | 23,186 | 25,146 | 14,934 | 4,757 | 68,023 | 794 | 22,849 | $125.00 | $125.00 | -1.97% | -2.40% | 4.17% |
| 2006 | 23,249 | 25,759 | 15,491 | 4,893 | 69,392 | 826 | 23,411 | $120.00 | $120.00 | -4.66% | -1.79% | 9.09% |
| 2005 | 24,648 | 27,526 | 15,808 | 4,799 | 72,781 | 899 | 23,838 | $110.00 | $110.00 | -8.30% | -7.29% | 10.00% |
| 2004 | 27,814 | 30,486 | 16,295 | 4,776 | 79,371 | 933 | 25,713 | $100.00 | $100.00 | -21.02% | -13.32% | 1.01% |
| 2003 | 36,260 | 38,444 | 20,478 | 5,314 | 100,496 | 1,116 | 29,664 | $99.00 | $99.00 | -14.71% | 0.76% | 41.43% |
| 2002 | 42,531 | 45,202 | 23,495 | 6,594 | 117,822 | 1,398 | 29,439 | $70.00 | $70.00 | -8.97% | -3.93% | 40.00% |
| 2001 | 46,805 | 49,776 | 25,452 | 7,394 | 129,427 | 1,487 | 30,643 | $50.00 | $50.00 | -7.93% | -6.96% | 11.11% |
| 2000 | 51,030 | 53,842 | 27,674 | 8,026 | 140,572 | 1,627 | 32,934 | $45.00 | $45.00 | -5.75% | -6.91% | 12.50% |
| 1999 | 54,440 | 57,310 | 28,904 | 8,497 | 149,151 | 1,783 | 35,377 | $40.00 | $40.00 | -4.53% | -5.64% | 0.00% |
| 1998 | 58,051 | 59,748 | 29,716 | 8,711 | 156,226 | 1,670 | 37,492 | $40.00 | $40.00 | -7.57% | -5.46% | 5.26% |
| 1997 | 63,395 | 64,179 | 32,932 | 8,510 | 169,016 | 1,693 | 39,656 | $38.00 | $38.00 | -1.18% | -1.26% | 36.94% |
| 1996 | 63,988 | 65,702 | 32,817 | 8,532 | 171,039 | 1,641 | 40,161 | $27.75 | $27.75 | 3.11% | 1.26% | 20.65% |
| 1995 | 61,923 | 64,309 | 31,583 | 8,060 | 165,875 | 1,612 | 39,663 | $23.00 | $23.00 | -3.14% | -4.11% | 2.91% |
| 1994 | 64,893 | 67,340 | 31,428 | 7,586 | 171,247 | 1,507 | 41,365 | $22.35 | $22.35 | -5.22% | -3.76% | 5.92% |
| 1993 | 69,703 | 70,394 | 32,724 | 7,855 | 180,676 | 1,646 | 42,979 | $21.10 | $21.10 | -3.75% | -1.23% | 3.94% |
| 1992 | 74,182 | 73,303 | 32,651 | 7,586 | 187,722 | 1,770 | 43,515 | $20.30 | $20.30 | -2.64% | -1.04% | 3.05% |
| 1991 | 76,597 | 75,965 | 33,122 | 7,123 | 192,807 | 1,660 | 43,974 | $19.70 | $19.70 | -2.38% | 0.06% | 2.07% |
| 1990 | 78,978 | 78,345 | 33,326 | 6,859 | 197,508 | 1,658 | 43,948 | $19.30 | $19.30 | -2.10% | -1.35% | 4.32% |
| 1989 | 79,553 | 80,290 | 34,672 | 7,237 | 201,752 | 1,734 | 44,551 | $18.50 | $18.50 | -0.89% | 1.52% | 12.12% |
| 1988 | 79,674 | 81,449 | 34,970 | 7,468 | 203,561 | 1,895 | 43,883 | $16.50 | $16.50 | -1.11% | -5.29% | 6.45% |
| 1987 | 79,699 | 82,575 | 36,311 | 7,267 | 205,852 | 1,963 | 46,336 | $15.50 | $15.50 | -3.39% | -1.53% | 14.81% |
| 1986 | 80,876 | 86,603 | 37,902 | 7,688 | 213,069 | 2,067 | 47,055 | $13.50 | $13.50 | -1.14% | -0.64% | 12.50% |
| 1985 | 80,399 | 88,544 | 38,873 | 7,713 | 215,529 | 2,046 | 47,356 | $12.00 | $12.00 | -2.59% | -1.85% | 14.29% |
| 1984 | 80,501 | 92,959 | 40,369 | 7,427 | 221,256 | 2,042 | 48,247 | $10.50 | $10.50 | -3.11% | 1.69% | 0.00% |
| 1983 | 81,595 | 97,584 | 42,418 | 6,754 | 228,351 | 2,043 | 47,447 | $10.50 | $10.50 | -1.98% | -0.10% | 5.00% |
| 1982 | 81,234 | 101,920 | 43,652 | 6,156 | 232,962 | 1,828 | 47,494 | $10.00 | $10.00 | -2.53% | 1.82% | 33.33% |
| 1981 | 79,769 | 108,538 | 44,492 | 6,211 | 239,010 | 1,849 | 46,647 | $7.50 | $7.50 | 1.03% | 2.27% | 0.00% |
| 1980 | 75,542 | 111,922 | 42,539 | 6,563 | 236,566 | 1,778 | 45,610 | $7.50 | $7.50 | -1.78% | 1.09% | 25.00% |
| 1979 | 72,523 | 115,680 | 45,844 | 6,811 | 240,858 | 1,972 | 45,118 | $6.00 | $6.00 | 1.39% | 4.78% | 0.00% |
| 1978 | 65,140 | 116,756 | 48,617 | 7,034 | 237,547 | 1,935 | 43,058 | $6.00 | $6.00 | 5.45% | 6.80% | |
| 1977 | 51,630 | 115,808 | 50,692 | 7,134 | 225,264 | 2,060 | 40,317 | 5.47% | 7.42% | |||
| 1976 | 35,671 | 117,851 | 53,010 | 7,045 | 213,577 | 2,075 | 37,531 | 3.35% | 9.10% | |||
| 1975 | 21,555 | 123,307 | 54,363 | 7,438 | 206,663 | 2,148 | 34,402 | -1.50% | 4.61% | |||
| 1974 | 12,278 | 131,797 | 57,332 | 8,395 | 209,802 | 2,525 | 32,887 | -1.56% | -1.03% | |||
| 1973 | 5,448 | 139,086 | 59,329 | 9,255 | 213,118 | 2,638 | 33,229 | $4.50 | $0.00 | -4.19% | 0.72% | 5.88% |
| 1972 | 1,144 | 147,985 | 63,202 | 10,115 | 222,446 | 2,850 | 32,993 | $4.25 | $0.00 | -5.87% | -1.97% | 70.00% |
| 1971 | 155,790 | 69,179 | 11,361 | 236,330 | 2,767 | 33,655 | $2.50 | $0.00 | 0.91% | 5.30% | ||
| 1970 | 154,706 | 68,214 | 11,289 | 234,209 | 2,750 | 31,962 | -5.91% | -0.26% | ||||
| 1969 | 164,344 | 73,336 | 11,251 | 248,931 | 3,233 | 32,046 | -4.03% | 0.85% | ||||
| 1968 | 169,189 | 80,604 | 9,593 | 259,386 | 3,477 | 31,775 | -0.83% | 2.03% | ||||
| 1967 | 169,861 | 85,222 | 6,484 | 261,567 | 3,719 | 31,142 | -0.95% | -4.05% | ||||
| 1966 | 170,519 | 88,400 | 5,163 | 264,082 | 4,295 | 32,456 | -6.29% | -3.19% | ||||
| 1965 | 179,107 | 99,991 | 2,722 | 281,820 | 4,594 | 33,524 | $2.50 | $0.00 | 0.80% | 0.54% | 0.00% | |
| 1964 | 177,009 | 102,580 | 279,589 | 6,251 | 33,345 | $2.50 | $0.00 | 1.25% | 1.28% | 0.00% | ||
| 1963 | 174,129 | 102,005 | 276,134 | 6,131 | 32,925 | $2.50 | $0.00 | -0.23% | 1.68% | 150.00% | ||
| 1962 | 171,458 | 105,320 | 276,778 | 5,178 | 32,380 | $1.00 | $0.00 | 2.40% | 2.90% | 0.00% | ||
| 1961 | 165,799 | 104,487 | 270,286 | 4,569 | 31,468 | $1.00 | $0.00 | 4.78% | 5.81% | 0.00% | ||
| 1960 | 157,028 | 100,935 | 257,963 | 4,149 | 29,740 | $1.00 | $0.00 | 5.97% | 9.50% | 0.00% | ||
| 1959 | 150,121 | 93,313 | 243,434 | 4,015 | 27,159 | $1.00 | $0.00 | 7.11% | 9.03% | 0.00% | ||
| 1958 | 143,273 | 84,003 | 227,276 | 3,808 | 24,909 | $1.00 | $0.00 | 8.67% | 10.47% | |||
| 1957 | 135,666 | 73,485 | 209,151 | 3,518 | 22,549 | 8.13% | 9.34% | |||||
| 1956 | 125,457 | 67,973 | 193,430 | 3,555 | 20,623 | 10.96% | 11.86% | |||||
| 1955 | 111,336 | 62,982 | 174,318 | 3,213 | 18,437 | 11.78% | 12.09% | |||||
| 1954 | 98,535 | 57,411 | 155,946 | 2,891 | 16,449 | 10.68% | 15.17% | |||||
| 1953 | 88,962 | 51,934 | 140,896 | 2,665 | 14,282 | 8.14% | 7.23% | |||||
| 1952 | 81,722 | 48,568 | 130,290 | 2,480 | 13,319 | 13.90% | 12.29% | |||||
| 1951 | 70,348 | 44,044 | 114,392 | 2,507 | 11,861 | 9.68% | 7.12% | |||||
| 1950 | 63,669 | 40,623 | 104,292 | 2,315 | 11,073 | 6.40% | 12.42% | |||||
| 1949 | 58,449 | 39,574 | 98,023 | 2,157 | 9,850 | 7.24% | 6.34% | |||||
| 1948 | 52,631 | 38,778 | 91,409 | 1,893 | 9,263 | -1.91% | 3.45% | |||||
| 1947 | 52,044 | 41,141 | 93,185 | 1,977 | 8,954 | 5.25% | 5.45% | |||||
| 1946 | 47,800 | 40,738 | 88,538 | 1,765 | 8,491 | 2.69% | 12.97% | |||||
| 1945 | 44,783 | 41,437 | 86,220 | 1,109 | 7,516 | $0.50 | $0.00 | 0.98% | 11.36% | 0.00% | ||
| 1944 | 43,871 | 41,511 | 85,382 | 978 | 6,749 | $0.50 | $0.00 | 7.18% | 0.75% | |||
| 1943 | 40,883 | 38,776 | 79,659 | 852 | 6,699 | 1.36% | 4.48% | |||||
| 1942 | 39,351 | 39,238 | 78,589 | 1,005 | 6,412 | $0.50 | $0.00 | -5.40% | -8.35% | 0.00% | ||
| 1941 | 39,552 | 43,523 | 83,075 | 1,510 | 6,996 | $0.50 | $0.00 | -4.76% | -12.21% | 0.00% | ||
| 1940 | 40,353 | 46,875 | 87,228 | 2,588 | 7,969 | $0.50 | $0.00 | -5.04% | -4.43% | |||
| 1939 | 41,037 | 50,825 | 91,862 | 3,221 | 8,338 | 8.13% | 4.20% | |||||
| 1938 | 37,307 | 47,652 | 84,959 | 2,927 | 8,002 | 10.89% | 7.35% | |||||
| 1937 | 33,118 | 43,496 | 76,614 | 2,704 | 7,454 | 0.14% | 6.79% | |||||
| 1936 | 31,120 | 45,387 | 76,507 | 2,904 | 6,980 | $0.50 | $0.00 | 6.68% | 6.96% | 0.00% | ||
| 1935 | 29,084 | 42,630 | 71,714 | 2,898 | 6,526 | $0.50 | $0.00 | 23.03% | 25.45% | |||
| 1934 | 24,244 | 34,044 | 58,288 | 2,621 | 5,202 | 1.15% | 8.47% | |||||
| 1933 | 23,329 | 34,294 | 57,623 | 2,339 | 4,796 | 3.33% | 3.12% | |||||
| 1932 | 23,140 | 32,627 | 55,767 | 1,836 | 4,651 | 5.89% | 5.70% | |||||
| 1931 | 22,260 | 30,403 | 52,663 | 1,505 | 4,400 | 10.75% | 13.26% | |||||
| 1930 | 19,112 | 28,439 | 47,551 | 1,136 | 3,885 | 4.17% | -2.51% | |||||
| 1929 | 16,814 | 28,832 | 45,646 | 855 | 3,985 | -1.42% | 6.95% | |||||
| 1928 | 16,872 | 29,433 | 46,305 | 691 | 3,726 | 2.65% | 7.91% | |||||
| 1927 | 16,320 | 28,790 | 45,110 | 745 | 3,453 | 2.21% | 3.11% | |||||
| 1926 | 15,319 | 28,817 | 44,136 | 593 | 3,349 | 7.88% | 0.18% | |||||
| 1925 | 13,053 | 27,858 | 40,911 | 336 | 3,343 | 2.53% | 13.44% | |||||
| 1924 | 13,387 | 26,516 | 39,903 | 2,947 | -17.24% | 11.12% | ||||||
| 1923 | 13,762 | 34,454 | 48,216 | 2,652 | 6.67% | 5.15% | ||||||
| 1922 | 11,480 | 33,720 | 45,200 | 2,522 | 35.34% | 23.14% | ||||||
| 1921 | 6,343 | 27,055 | 33,398 | 36 | 2,048 | 23.80% | 24.27% | |||||
| 1920 | 4,288 | 22,690 | 26,978 | 1,648 | 14.19% | 3.71% | ||||||
| 1919 | 2,738 | 20,887 | 23,625 | 1,589 | 22.86% | 32.42% | ||||||
| 1918 | 1,806 | 17,423 | 19,229 | 1,200 | 4.50% | 12.89% | ||||||
| 1917 | 1,257 | 17,144 | 18,401 | 1,063 | 2.44% | 3.00% | ||||||
| 1916 | 421 | 17,542 | 17,963 | 1,032 | 9.91% | -4.80% | ||||||
| 1915 | 16,343 | 16,343 | 1,084 | 20.48% | 18.86% | |||||||
| 1914 | 13,565 | 13,565 | 912 | |||||||||