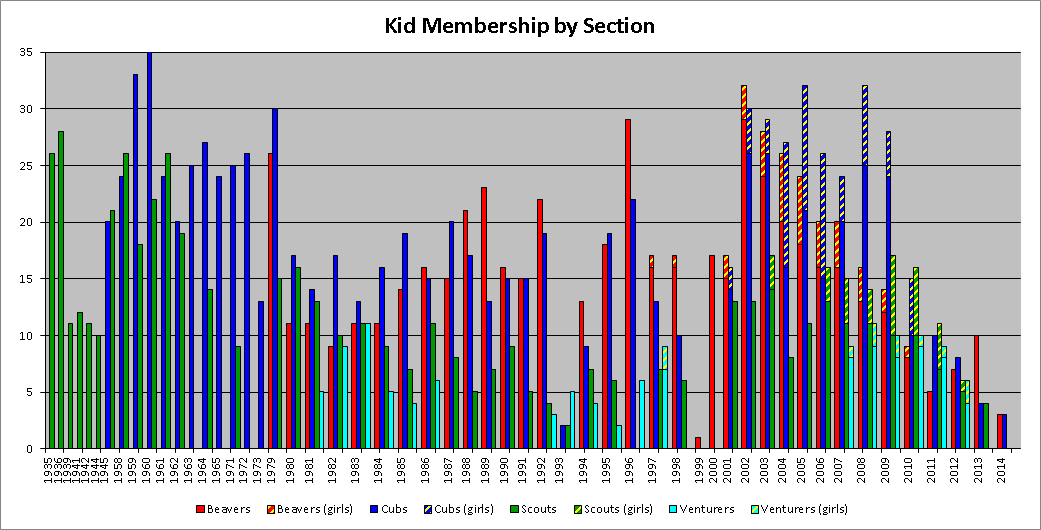
The following is based on the information available in the archives. Note that just because no kids are listed as being registered in a given year doesn't mean there weren't any. It just means that those records may not exist.
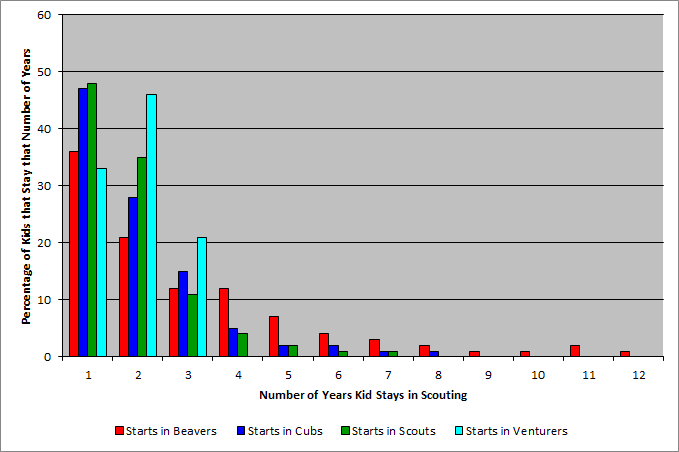
This is the average number of years a kid stays in Scouting based on which was their first section. i.e. If a kids starts in Beavers 36% leave after one year, but if they start in Scouts then 49% leave after one year.
| Starting Section | Average |
|---|---|
| Colony | 2.91 years |
| Pack | 1.99 years |
| Troop | 1.79 years |
| Company | 1.79 years |
| Crew | 1.00 years |
| Overall | 2.27 years |
| Years | Count | Overall | Colony | Pack | Troop | Company | Crew |
|---|---|---|---|---|---|---|---|
| 1 | 396 | 19% | 36% | 47% | 49% | 42% | 100% |
| 2 | 245 | 11% | 21% | 28% | 34% | 34% | |
| 3 | 118 | 5% | 12% | 15% | 11% | 11% | |
| 4 | 66 | 3% | 12% | 6% | 3% | 3% | |
| 5 | 36 | 1% | 8% | 2% | 2% | 2% | |
| 6 | 20 | 4% | 2% | 1% | 1% | ||
| 7 | 14 | 3% | 1% | 1% | 1% | ||
| 8 | 6 | 2% | |||||
| 9 | 1 | ||||||
| 10 | 6 | 2% | |||||
| 11 | 5 | 2% |
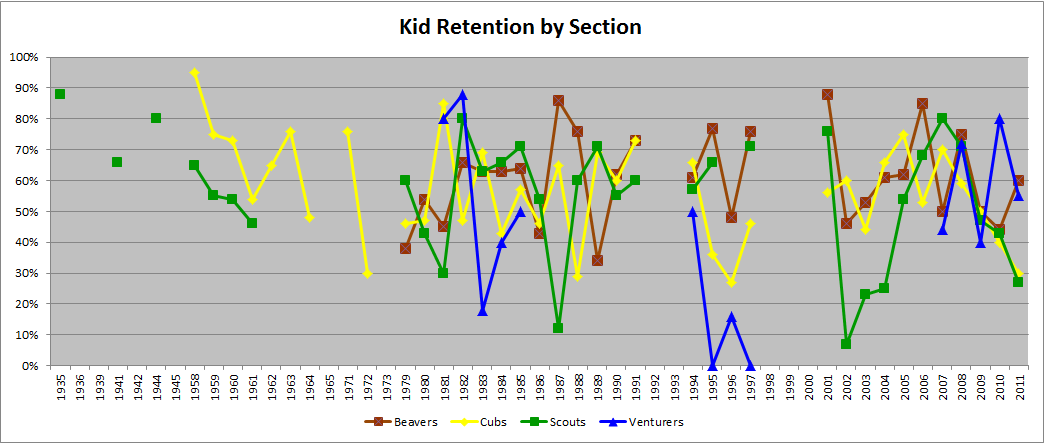
Retention figures can only be given for consecutive years where the membership list is available. In some cases, just a membership count is available, no individual names. For simplicity, the retention figure includes both same and next section. It is also assumed that Scouts don't age out until the age of 16.
| Year | Beavers | Cubs | Scouts | Venturers | Rovers | ||||
|---|---|---|---|---|---|---|---|---|---|
| Count | Retention | Count | Retention | Count | Retention | Count | Retention | Count | |
| Average | 16 | 61% | 20 | 58% | 12 | 58% | 7 | 64% | 2 |
| 2014 | 3 | 3 | |||||||
| 2013 | 10 | 4 | 4 | ||||||
| 2012 | 4 | 7 | 5 | 7 | |||||
| 2011 | 5 | 60% | 10 | 30% | 11 | 27% | 9 | 55% | |
| 2010 | 9 | 44% | 15 | 40% | 12 | 43% | 10 | 80% | |
| 2009 | 14 | 50% | 28 | 50% | 17 | 47% | 10 | 40% | |
| 2008 | 16 | 75% | 32 | 59% | 14 | 71% | 11 | 72% | |
| 2007 | 20 | 50% | 24 | 70% | 15 | 80% | 9 | 44% | |
| 2006 | 20 | 85% | 26 | 53% | 16 | 68% | |||
| 2005 | 24 | 62% | 32 | 75% | 11 | 54% | |||
| 2004 | 26 | 61% | 27 | 66% | 8 | 25% | |||
| 2003 | 28 | 53% | 29 | 44% | 17 | 23% | |||
| 2002 | 32 | 46% | 30 | 60% | 13 | 7% | |||
| 2001 | 17 | 88% | 16 | 56% | 13 | 76% | |||
| 2000 | |||||||||
| 1999 | |||||||||
| 1998 | 17 | 10 | 6 | ||||||
| 1997 | 17 | 76% | 13 | 46% | 7 | 71% | 9 | 0% | |
| 1996 | 29 | 48% | 22 | 27% | 6 | 16% | |||
| 1995 | 18 | 77% | 19 | 36% | 6 | 66% | 2 | 0% | |
| 1994 | 13 | 61% | 9 | 66% | 7 | 57% | 4 | 50% | |
| 1993 | 2 | 2 | 5 | ||||||
| 1992 | 23 | 19 | 4 | 3 | |||||
| 1991 | 15 | 73% | 15 | 73% | 5 | 60% | |||
| 1990 | 16 | 62% | 15 | 60% | 9 | 55% | |||
| 1989 | 24 | 34% | 13 | 69% | 7 | 71% | |||
| 1988 | 21 | 76% | 17 | 29% | 5 | 60% | |||
| 1987 | 15 | 86% | 20 | 65% | 8 | 12% | |||
| 1986 | 16 | 43% | 15 | 46% | 11 | 54% | 6 | 0% | |
| 1985 | 14 | 64% | 19 | 57% | 7 | 71% | 4 | 50% | |
| 1984 | 11 | 63% | 16 | 43% | 9 | 66% | 5 | 40% | |
| 1983 | 11 | 63% | 13 | 69% | 11 | 63% | 11 | 18% | |
| 1982 | 9 | 66% | 17 | 47% | 10 | 80% | 9 | 88% | 2 |
| 1981 | 11 | 45% | 15 | 85% | 3 | 30% | 5 | 80% | |
| 1980 | 11 | 54% | 17 | 47% | 16 | 43% | |||
| 1979 | 26 | 38% | 30 | 46% | 15 | 60% | |||
| 1973 | 13 | ||||||||
| 1972 | 28 | 30% | 0 | ||||||
| 1971 | 25 | 76% | 9 | ||||||
| 1965 | 24 | 0 | |||||||
| 1964 | 27 | 48% | 14 | ||||||
| 1963 | 25 | 76% | 17 | N/A | |||||
| 1962 | 24 | 65% | 20 | ||||||
| 1961 | 24 | 54% | 26 | 46% | |||||
| 1960 | 38 | 73% | 22 | 54% | |||||
| 1959 | 33 | 75% | 18 | 55% | |||||
| 1958 | 24 | 95% | 27 | 65% | |||||
| 1945 | 21 | 21 | |||||||
| 1944 | 10 | 80% | |||||||
| 1942 | 11 | ||||||||
| 1941 | 12 | 66% | |||||||
| 1939 | 11 | ||||||||
| 1936 | 29 | ||||||||
| 1935 | 26 | 88% | |||||||