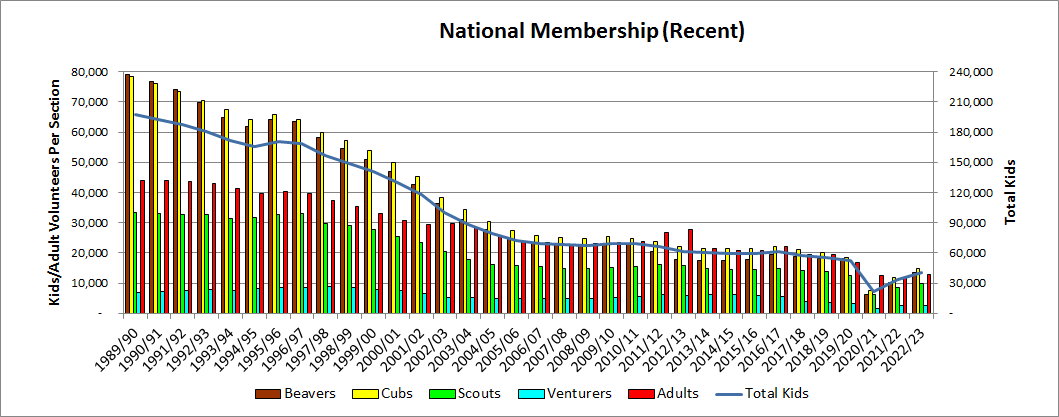
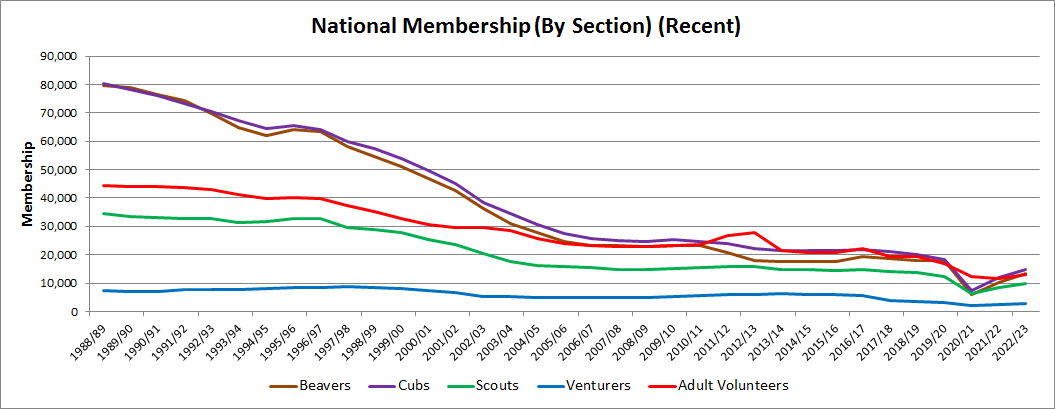
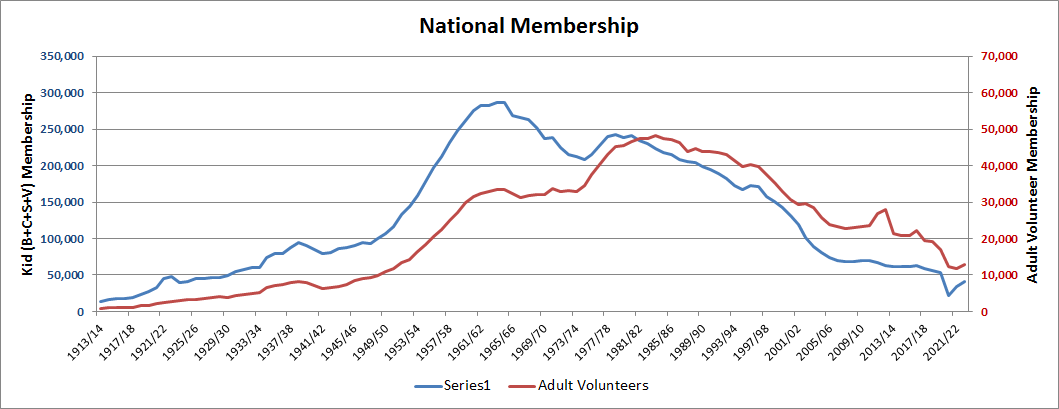
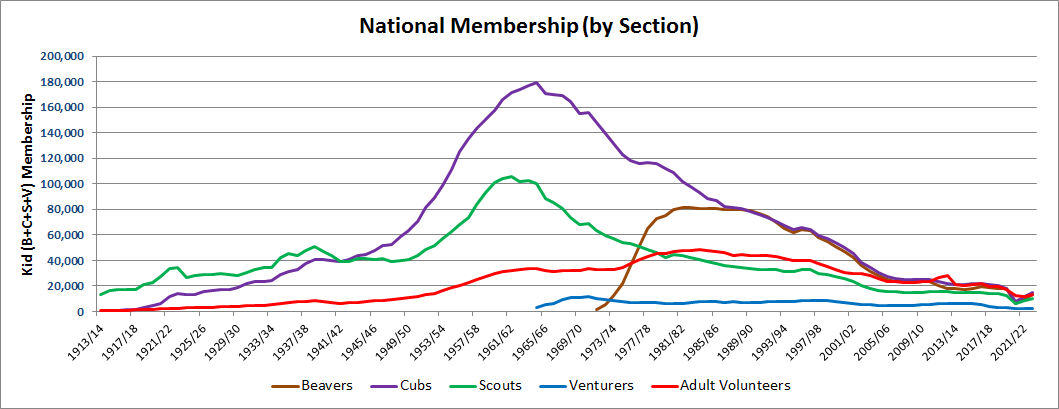
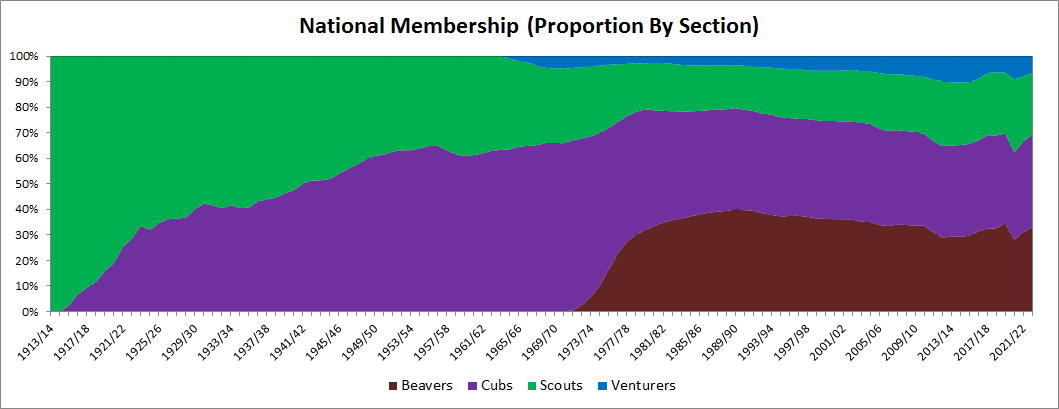
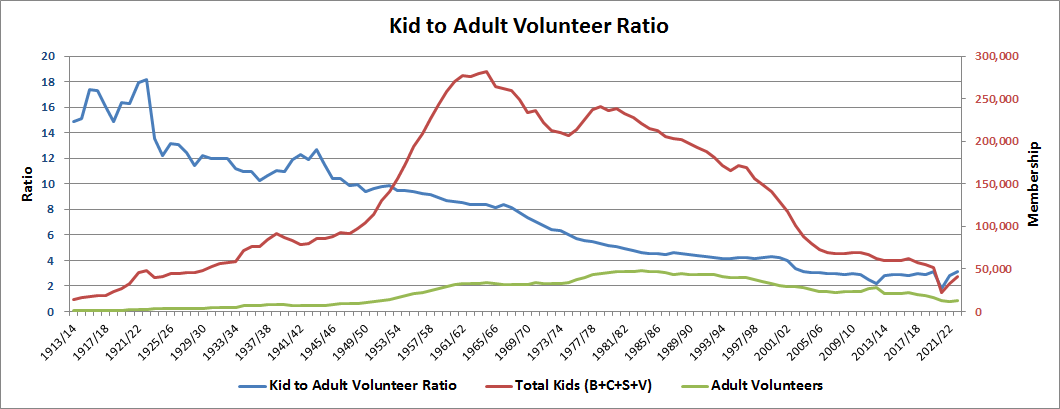
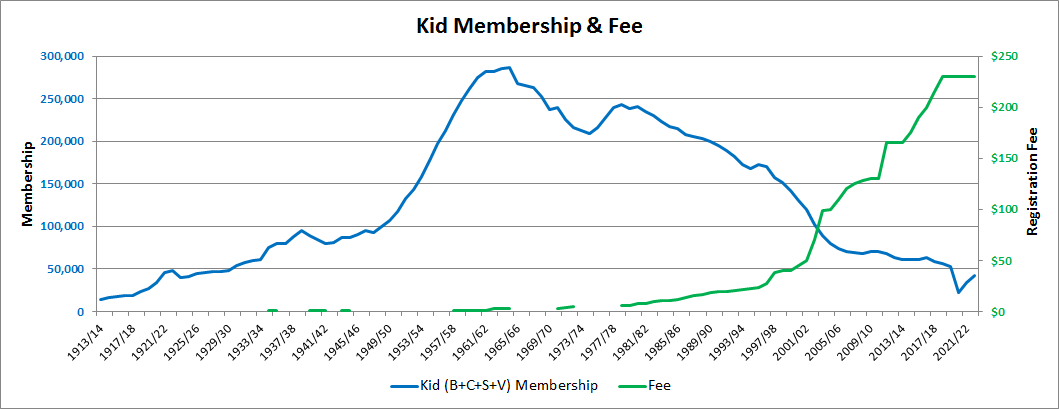
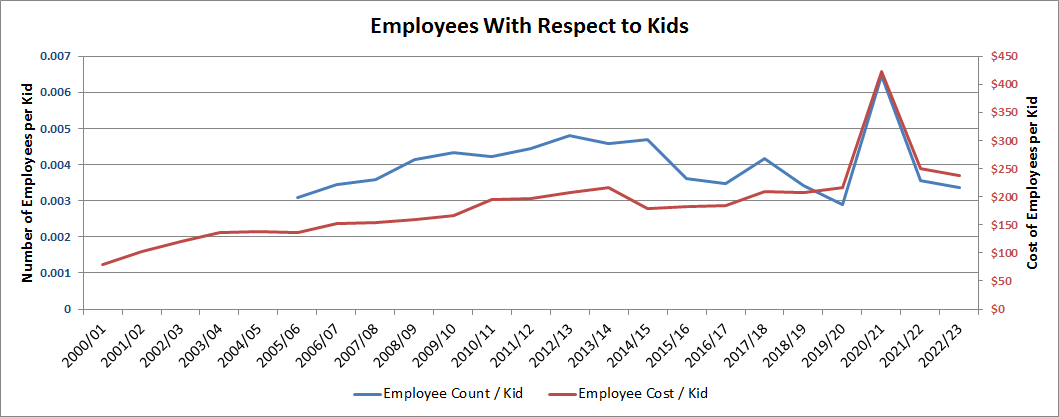
The following is based on data from the national archives and Scouts Canada annual reports. Note that the year is the Scouting year. So 2004 means the September 2004 - August 2005 Scouting year. This figure would appear in the 2005 annual report. For clarity in some of the graphs, figures for Rovers, ScoutsAbout, Extreme Scouting are not shown, as ScoutsAbout is just a day care service and the others only amount to 0.01% of the total kids in the program. Thus the total kids only includes Beavers, Cubs, Scouts, and Venturers.
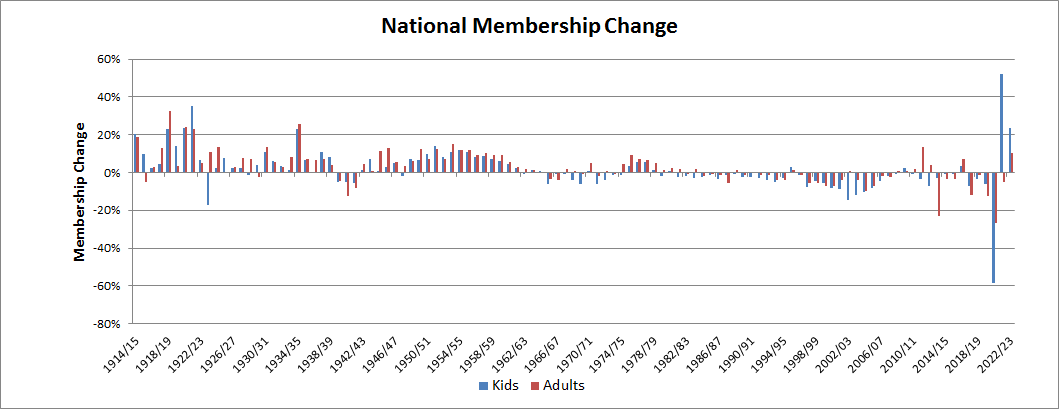
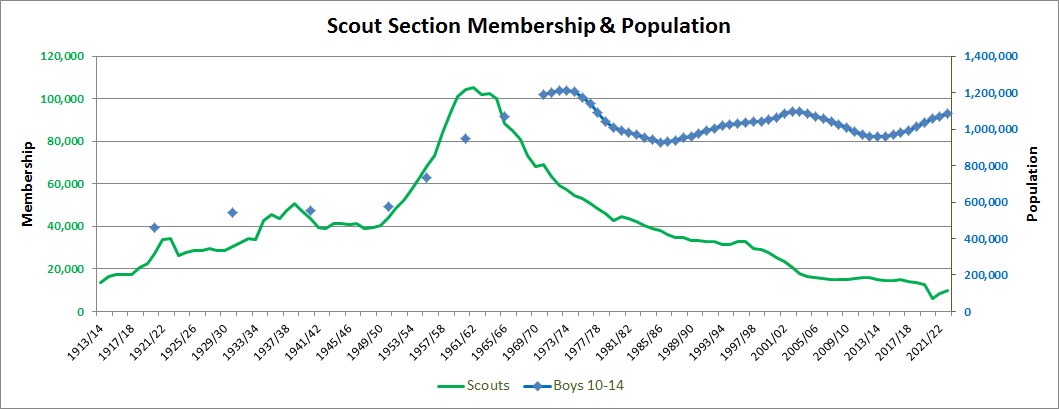
Be careful on infering any causal relationships between the data on any given graph.
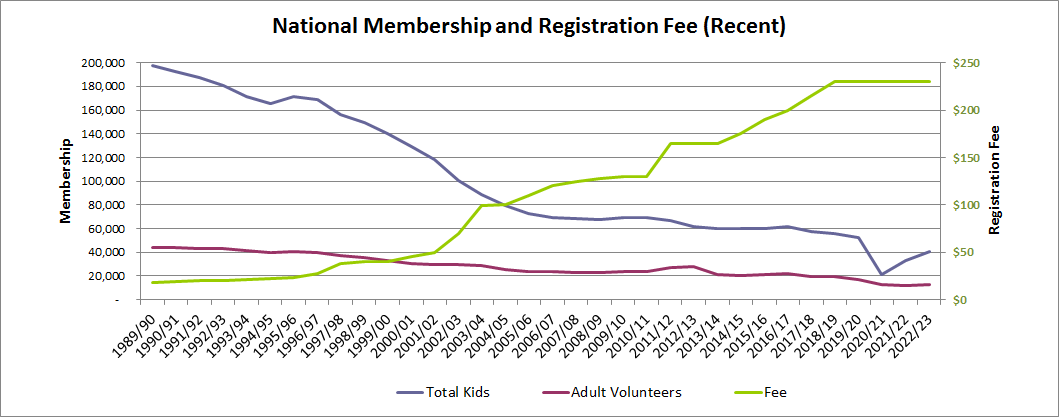
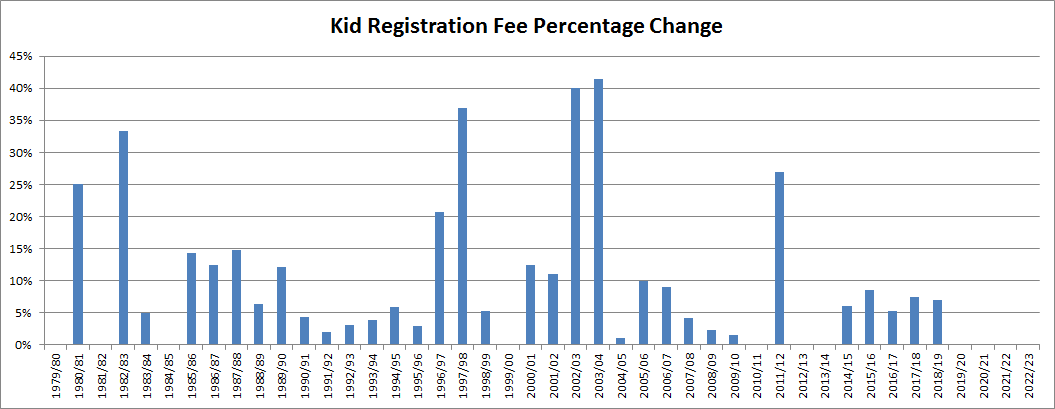
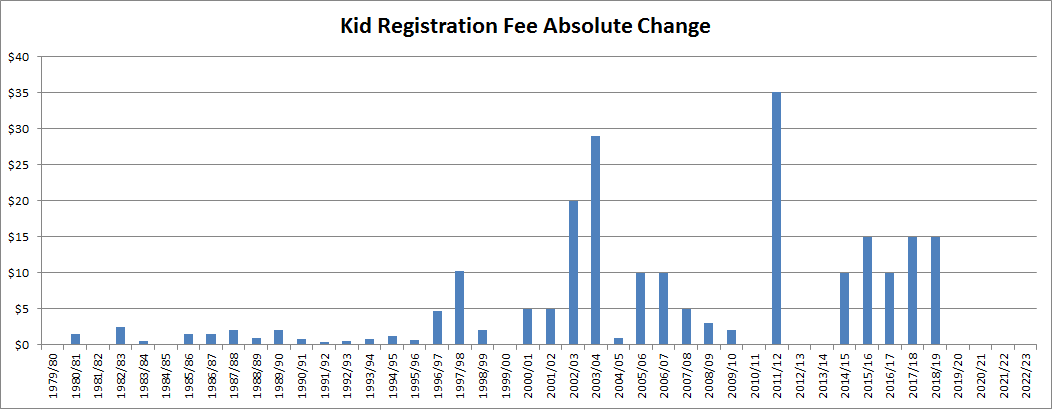
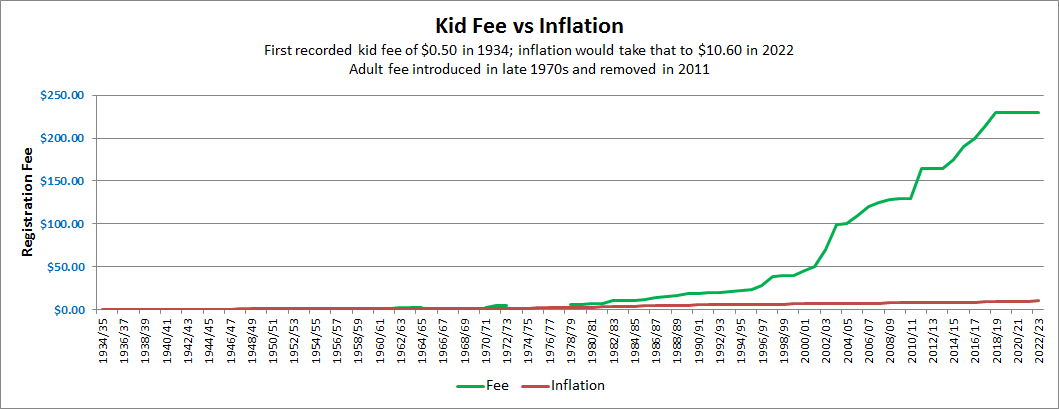
The registration fee is for a group in Voyageur Council, and includes both the national and council portions. Groups in other councils may have slightly higher or lower fees. As of the 2015/16 Scouting year, the registration fee has been standardised across the country for all councils.
Initially Scouts Canada was for boys only. Venturers had the option for co-ed in 1984, with Beavers/Cubs/Scouts getting that option in 1992. Co-ed became mandatory in 1998. The addition of girls needs to be taken into account when comparing statistics across years. Approximately 13% of the kids overall are girls.
The Advance Party Report in the UK in 1966, implemented as by Scouts Canada in 1969, changed the face of Scouting.
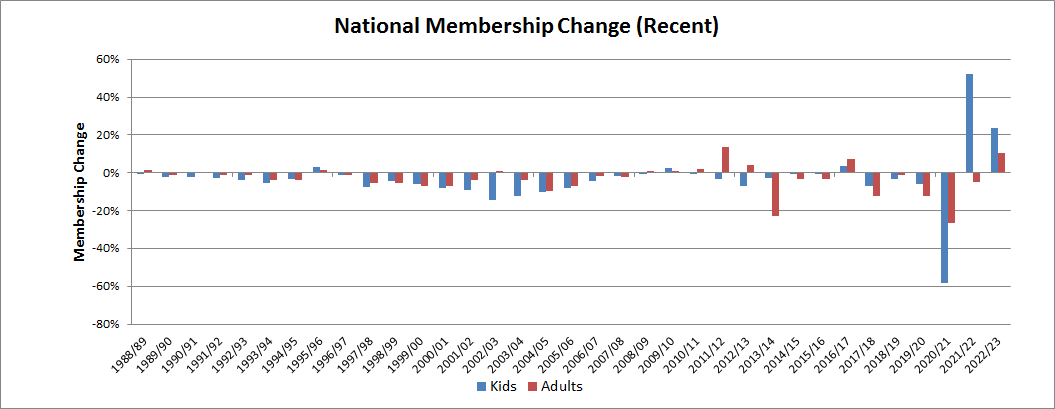
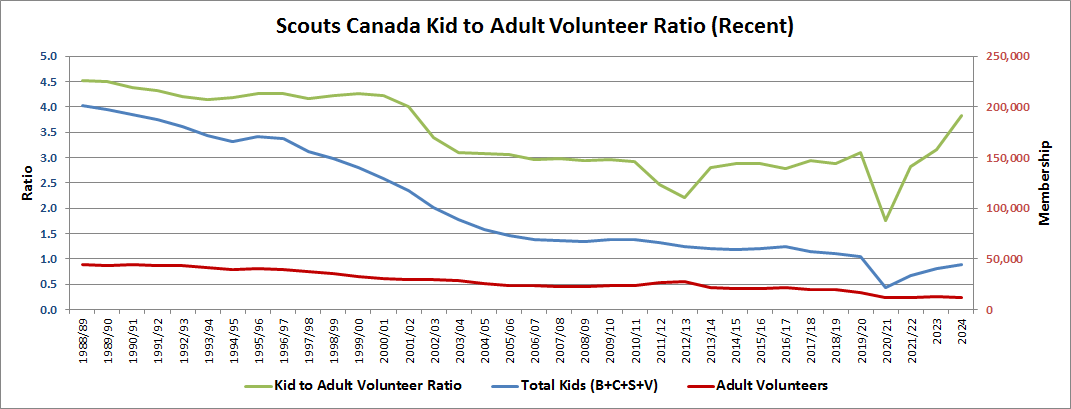
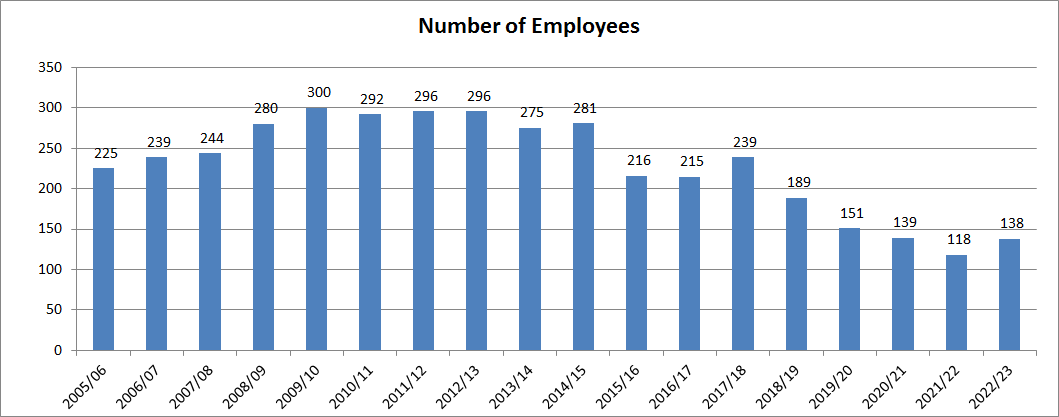
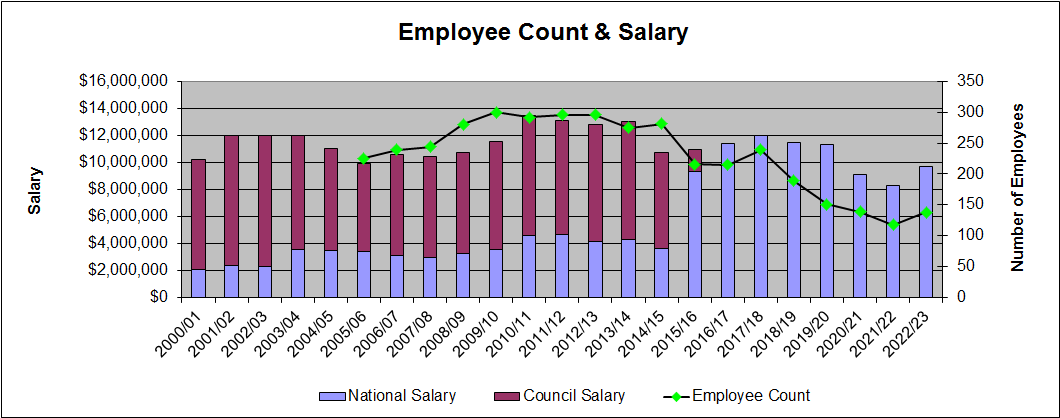
In the year 2011/12 & 2012/13, there was a large reported surge in the number of adult volunteers. This coincided with the introduction of the AMS member management system, subsequently re-branded as MyScouts. The following year a number of councils restarted the number of adult volunteers in those years as much lower, so evidently the original counts were incorrect. However, no restatement was performed at the national level, so the (incorrect) numbers remain as the official record.
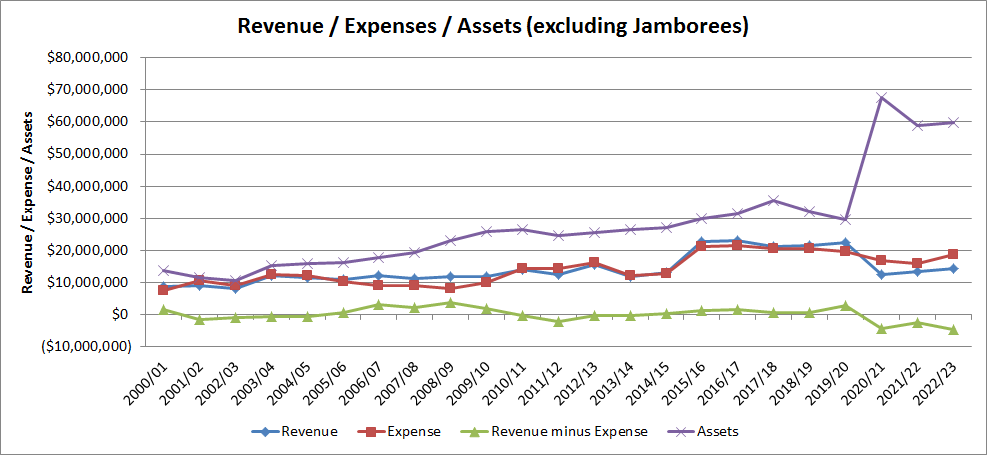
In the year 2015/16, national started including council level financials within the national level reporting.
As of 2021, Scouts Canada switched to a calendar year for membership. Previously membership was September to August.
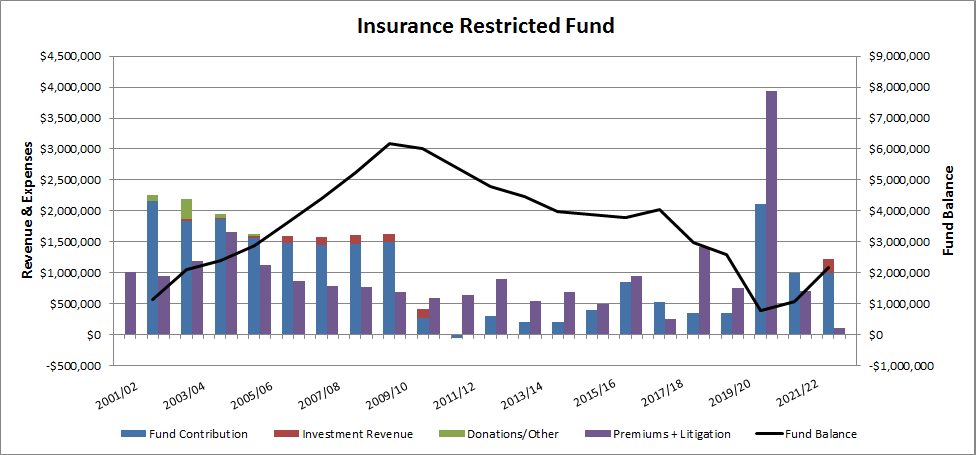
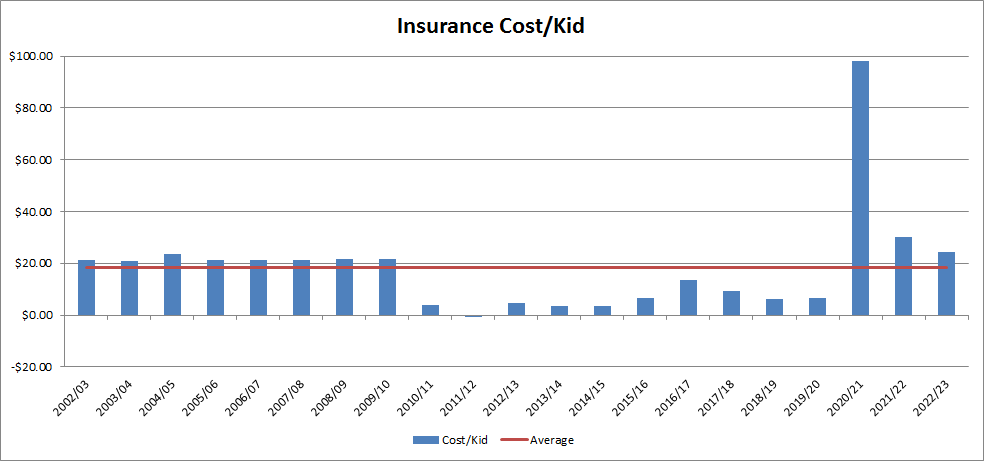
2020/21 was the year of the plague, otherwise known as Covid. Statistics from this year are essentially a meaningless from a comparison perspective with previous years.
| Document | |
|---|---|
| Scouts Canada Retention Survey Report, IPSOS Reid, 2011 | |
| Scouts Canada Program Review, 2012 | |
| Membership Retention in Scout Troops, Liam Morland, 2002 | |
| Membership Retention in Scout Troops, World Scientific Congress, Liam Morland | |
| Scouting Now Report 2011 | |
| Scouting Now Report Highlights 2011 | |
| Scouting Action Plan | |
| Scouting Now Story | |
| Scouts Canada Attrition Analysis 2012 | |
| Scouts Canada Strategic Plan 2014 |
| Year | Annual Report | Annual Financials | Annual Financials Summary |
|---|---|---|---|
| 2024/24 | |||
| 2023/24 | |||
| 2022/23 | |||
| 2021/22 | |||
| 2020/21 | |||
| 2019/20 | |||
| 2018/19 | |||
| 2017/18 | |||
| 2016/17 | |||
| 2015/16 | |||
| 2014/15 | |||
| 2013/14 | |||
| 2012/13 | |||
| 2011/12 | |||
| 2010/11 | |||
| 2009/10 | |||
| 2008/09 | |||
| 2007/08 | |||
| 2006/07 | |||
| 2005/06 | |||
| 2004/05 | |||
| 2003/04 | |||
| 2002/03 | |||
| 2001/02 |
| Council | 2006/07 | 2007/08 | 2008/09 | 2009/10 | 2010/11 | 2011/12 | 2012/13 | 2013/14 | 2014/15 | 2015/16 |
|---|---|---|---|---|---|---|---|---|---|---|
| Battlefields | ||||||||||
| Cascadia | ||||||||||
| Central Escarpment | ||||||||||
| Chinook | ||||||||||
| Fraser Valley | ||||||||||
| Manitoba | ||||||||||
| New Brunswick | ||||||||||
| Newfoundland | ||||||||||
| Northern Lights | ||||||||||
| Northern Ontario | ||||||||||
| Nova Scotia | ||||||||||
| Pacific Coast | ||||||||||
| Prince Edward Island | ||||||||||
| Quebec | ||||||||||
| Saskatchawan | ||||||||||
| Shining Waters | ||||||||||
| Toronto | ||||||||||
| Tri-Shores | ||||||||||
| Voyageur | ||||||||||
| White Pine |
| Council | 2006/07 | 2007/08 | 2008/09 | 2009/10 | 2010/11 | 2011/12 | 2012/13 | 2013/14 | 2014/15 |
|---|---|---|---|---|---|---|---|---|---|
| Battlefields | |||||||||
| Cascadia | |||||||||
| Central Escarpment | |||||||||
| Chinook | |||||||||
| Fraser Valley | |||||||||
| Manitoba | |||||||||
| Newfoundland | |||||||||
| New Brunswick | |||||||||
| Northern Lights | |||||||||
| Northern Ontario | |||||||||
| Nova Scotia | |||||||||
| Pacific Coast | |||||||||
| Prince Edward Island | |||||||||
| Quebec | |||||||||
| Saskatchawan | |||||||||
| Shining Waters | |||||||||
| Toronto | |||||||||
| Tri-Shores | |||||||||
| Voyageur | |||||||||
| White Pine |
| Year | Annual Financial Report |
|---|---|
| 2021/22 | |
| 2020/21 | |
| 2019/20 | |
| 2018/19 | |
| 2017/18 | |
| 2016/17 | |
| 2015/16 | |
| 2014/15 | |
| 2013/14 | |
| 2012/13 | |
| 2011/12 | |
| 2010/11 | |
| 2009/10 | |
| 2008/09 | |
| 2007/08 | |
| 2006/07 | |
| 2005/06 | |
| 2004/05 |
| Year | Beavers | Cubs | Scouts | Venturers | Total Kids | Rovers | Adults | Fee | Regn Change | Kid Fee Change | ||
|---|---|---|---|---|---|---|---|---|---|---|---|---|
| Kids | Adults | Kids | Adults | |||||||||
| 2026/27 | $295.00 | $0.00 | 6.50% | |||||||||
| 2026 | $277.00 | $0.00 | 2.59% | |||||||||
| 2025 | 13,683 | 16,138 | 11,991 | 3,282 | 45,094 | 852 | 15,113 | $270.00 | $0.00 | 1.84% | 30.76% | 17.39% |
| 2024 | 14,502 | 15,918 | 11,085 | 2,776 | 44,281 | 794 | 11,558 | $230.00 | $0.00 | 8.09% | -10.82% | 0.00% |
| 2023 | 13,508 | 14,819 | 9,950 | 2,691 | 40,968 | 741 | 12,960 | $230.00 | $0.00 | 23.40% | 10.16% | 0.00% |
| 2022 | 10,300 | 11,800 | 8,500 | 2,600 | 33,200 | 700 | 11,765 | $230.00 | $0.00 | 54.50% | -4.98% | 0.00% |
| 2021 | 6,137 | 7,456 | 6,216 | 1,679 | 21,488 | 449 | 12,381 | $230.00 | $0.00 | -58.85% | -26.67% | 0.00% |
| 2019/20 | 18,085 | 18,356 | 12,470 | 3,309 | 52,220 | 1,039 | 16,885 | $230.00 | $0.00 | -5.90% | -12.56% | 0.00% |
| 2018/19 | 18,091 | 20,167 | 13,781 | 3,456 | 55,435 | 1,307 | 19,310 | $230.00 | $0.00 | -3.50% | -1.06% | 6.98% |
| 2017/18 | 18,709 | 21,005 | 14,006 | 3,790 | 57,510 | 1,371 | 19,517 | $215.00 | $0.00 | -7.01% | -12.08% | 7.50% |
| 2016/17 | 19,396 | 21,989 | 14,939 | 5,522 | 61,846 | 1,614 | 22,198 | $200.00 | $0.00 | 3.53% | 7.15% | 5.26% |
| 2015/16 | 17,765 | 21,512 | 14,505 | 6,038 | 59,820 | 1,618 | 20,756 | $190.00 | $0.00 | 0.14% | 0.19% | 8.57% |
| 2014/15 | 17,512 | 21,450 | 14,661 | 6,114 | 59,737 | 1,520 | 20,717 | $175.00 | $0.00 | -0.35% | -3.36% | 6.06% |
| 2013/14 | 17,598 | 21,367 | 14,788 | 6,191 | 59,944 | 1,062 | 21,437 | $165.00 | $0.00 | -2.99% | -23.16% | 0.00% |
| 2012/13 | 17,925 | 22,158 | 15,736 | 5,971 | 61,790 | 1,149 | 27,898 | $165.00 | $0.00 | -7.14% | 3.81% | 0.00% |
| 2011/12 | 20,622 | 23,795 | 16,014 | 6,107 | 66,538 | 1,104 | 26,873 | $165.00 | $0.00 | -3.57% | 13.52% | 26.92% |
| 2010/11 | 23,248 | 24,801 | 15,407 | 5,543 | 68,999 | 897 | 23,672 | $130.00 | $130.00 | -0.12% | 1.68% | 0.00% |
| 2009/10 | 23,251 | 25,334 | 15,205 | 5,295 | 69,085 | 794 | 23,280 | $130.00 | $130.00 | 2.26% | 1.05% | 1.56% |
| 2008/09 | 22,931 | 24,806 | 14,867 | 4,952 | 67,556 | 703 | 23,039 | $128.00 | $128.00 | -0.69% | 0.83% | 2.40% |
| 2007/08 | 23,186 | 25,146 | 14,934 | 4,757 | 68,023 | 794 | 22,849 | $125.00 | $125.00 | -1.97% | -2.40% | 4.17% |
| 2006/07 | 23,249 | 25,759 | 15,491 | 4,893 | 69,392 | 826 | 23,411 | $120.00 | $120.00 | -4.66% | -1.79% | 9.09% |
| 2005/06 | 24,648 | 27,526 | 15,808 | 4,799 | 72,781 | 899 | 23,838 | $110.00 | $110.00 | -8.30% | -7.29% | 10.00% |
| 2004/05 | 27,814 | 30,486 | 16,295 | 4,776 | 79,371 | 933 | 25,713 | $100.00 | $100.00 | -10.17% | -9.59% | 1.01% |
| 2003/04 | 31,089 | 34,359 | 17,755 | 5,157 | 88,360 | 1,010 | 28,440 | $99.00 | $99.00 | -12.08% | -4.13% | 41.43% |
| 2002/03 | 36,260 | 38,444 | 20,478 | 5,314 | 100,496 | 1,116 | 29,664 | $70.00 | $70.00 | -14.71% | 0.76% | 41.43% |
| 2001/02 | 42,531 | 45,202 | 23,495 | 6,594 | 117,822 | 1,398 | 29,439 | $50.00 | $50.00 | -8.97% | -3.93% | 40.00% |
| 2000/01 | 46,805 | 49,776 | 25,452 | 7,394 | 129,427 | 1,487 | 30,643 | $45.00 | $45.00 | -7.93% | -6.96% | 11.11% |
| 1999/00 | 51,030 | 53,842 | 27,674 | 8,026 | 140,572 | 1,627 | 32,934 | $40.00 | $40.00 | -5.75% | -6.91% | 12.50% |
| 1998/99 | 54,440 | 57,310 | 28,904 | 8,497 | 149,151 | 1,783 | 35,377 | $40.00 | $40.00 | -4.53% | -5.64% | 0.00% |
| 1997/98 | 58,051 | 59,748 | 29,716 | 8,711 | 156,226 | 1,670 | 37,492 | $38.00 | $38.00 | -7.57% | -5.46% | 5.26% |
| 1996/97 | 63,395 | 64,179 | 32,932 | 8,510 | 169,016 | 1,693 | 39,656 | $27.75 | $27.75 | -1.18% | -1.26% | 36.94% |
| 1995/96 | 63,988 | 65,702 | 32,817 | 8,532 | 171,039 | 1,641 | 40,161 | $23.00 | $23.00 | 3.11% | 1.26% | 20.65% |
| 1994/95 | 61,923 | 64,309 | 31,583 | 8,060 | 165,875 | 1,612 | 39,656 | $22.35 | $22.35 | -3.14% | -4.11% | 2.91% |
| 1993/94 | 64,893 | 67,340 | 31,428 | 7,586 | 171,247 | 1,507 | 41,365 | $21.10 | $22.35 | -5.22% | -3.76% | 5.92% |
| 1992/93 | 69,703 | 70,394 | 32,724 | 7,855 | 180,676 | 1,646 | 42,979 | $20.30 | $20.30 | -3.75% | -1.23% | 3.94% |
| 1991/92 | 74,182 | 73,303 | 32,651 | 7,586 | 187,722 | 1,770 | 43,515 | $19.70 | $19.70 | -2.64% | -1.04% | 3.05% |
| 1990/91 | 76,597 | 75,965 | 33,122 | 7,123 | 192,807 | 1,660 | 43,974 | $19.30 | $19.30 | -2.38% | 0.06% | 2.07% |
| 1989/90 | 78,978 | 78,345 | 33,326 | 6,859 | 197,508 | 1,658 | 43,948 | $18.50 | $18.50 | -2.10% | -1.35% | 4.32% |
| 1988/89 | 79,553 | 80,290 | 34,672 | 7,237 | 201,752 | 1,734 | 44,551 | $16.50 | $16.50 | -0.89% | 1.52% | 12.12% |
| 1987/88 | 79,674 | 81,449 | 34,970 | 7,468 | 203,561 | 1,895 | 43,883 | $15.50 | $15.50 | -1.11% | -5.29% | 6.45% |
| 1986/87 | 79,699 | 82,575 | 36,311 | 7,267 | 205,852 | 1,963 | 46,336 | $13.50 | $13.50 | -3.39% | -1.53% | 14.81% |
| 1985/86 | 80,876 | 86,603 | 37,902 | 7,688 | 213,069 | 2,067 | 47,055 | $12.00 | $12.00 | -1.14% | -0.64% | 12.50% |
| 1984/85 | 80,399 | 88,544 | 38,873 | 7,713 | 215,529 | 2,046 | 47,356 | $10.50 | $10.50 | -2.59% | -1.85% | 14.29% |
| 1983/84 | 80,501 | 92,959 | 40,369 | 7,427 | 221,256 | 2,042 | 48,247 | $10.50 | $10.50 | -3.11% | 1.69% | 0.00% |
| 1982/83 | 81,595 | 97,584 | 42,418 | 6,754 | 228,351 | 2,043 | 47,447 | $10.00 | $10.00 | -1.98% | -0.10% | 5.00% |
| 1981/82 | 81,234 | 101,920 | 43,652 | 6,156 | 232,962 | 1,828 | 47,494 | $7.50 | $7.50 | -2.53% | 1.82% | 33.33% |
| 1980/81 | 79,769 | 108,538 | 44,492 | 6,211 | 239,010 | 1,849 | 46,647 | $7.50 | $7.50 | 1.03% | 2.27% | 0.00% |
| 1979/80 | 75,542 | 111,922 | 42,539 | 6,563 | 236,566 | 1,778 | 45,610 | $6.00 | $6.00 | -1.78% | 1.09% | 25.00% |
| 1978/79 | 72,523 | 115,680 | 45,844 | 6,811 | 240,858 | 1,972 | 45,118 | $6.00 | $6.00 | 1.39% | 4.78% | 0.00% |
| 1977/78 | 65,140 | 116,756 | 48,617 | 7,034 | 237,547 | 1,935 | 43,058 | 5.45% | 6.80% | |||
| 1976/77 | 51,630 | 115,808 | 50,692 | 7,134 | 225,264 | 2,060 | 40,317 | 5.47% | 7.42% | |||
| 1975/76 | 35,671 | 117,851 | 53,010 | 7,045 | 213,577 | 2,075 | 37,531 | 3.35% | 9.10% | |||
| 1974/75 | 21,555 | 123,307 | 54,363 | 7,438 | 206,663 | 2,148 | 34,402 | -1.50% | 4.61% | |||
| 1973/74 | 12,278 | 131,797 | 57,332 | 8,395 | 209,802 | 2,525 | 32,887 | -1.56% | -1.03% | |||
| 1972/73 | 5,448 | 139,086 | 59,329 | 9,255 | 213,118 | 2,638 | 33,229 | $4.50 | $0.00 | -4.19% | 0.72% | 5.88% |
| 1971/72 | 1,144 | 147,985 | 63,202 | 10,115 | 222,446 | 2,850 | 32,993 | $4.25 | $0.00 | -5.87% | -1.97% | 70.00% |
| 1970/71 | 155,790 | 69,179 | 11,361 | 236,330 | 2,767 | 33,655 | $2.50 | $0.00 | 0.91% | 5.30% | ||
| 1969/70 | 154,706 | 68,214 | 11,289 | 234,209 | 2,750 | 31,962 | -5.91% | -0.26% | ||||
| 1968/79 | 164,344 | 73,336 | 11,251 | 248,931 | 3,233 | 32,046 | -4.03% | 0.85% | ||||
| 1967/68 | 169,189 | 80,604 | 9,593 | 259,386 | 3,477 | 31,775 | -0.83% | 2.03% | ||||
| 1966/67 | 169,861 | 85,222 | 6,484 | 261,567 | 3,719 | 31,142 | -0.95% | -4.05% | ||||
| 1965/66 | 170,519 | 88,400 | 5,163 | 264,082 | 4,295 | 32,456 | -6.29% | -3.19% | ||||
| 1964/65 | 179,107 | 99,991 | 2,722 | 281,820 | 4,594 | 33,524 | $2.50 | $0.00 | 0.80% | 0.54% | 0.00% | |
| 1963/64 | 177,009 | 102,580 | 279,589 | 6,251 | 33,345 | $2.50 | $0.00 | 1.25% | 1.28% | 0.00% | ||
| 1962/63 | 174,129 | 102,005 | 276,134 | 6,131 | 32,925 | $2.50 | $0.00 | -0.23% | 1.68% | 150.00% | ||
| 1961/62 | 171,458 | 105,320 | 276,778 | 5,178 | 32,380 | $1.00 | $0.00 | 2.40% | 2.90% | 0.00% | ||
| 1960/61 | 165,799 | 104,487 | 270,286 | 4,569 | 31,468 | $1.00 | $0.00 | 4.78% | 5.81% | 0.00% | ||
| 1959/60 | 157,028 | 100,935 | 257,963 | 4,149 | 29,740 | $1.00 | $0.00 | 5.97% | 9.50% | 0.00% | ||
| 1958/69 | 150,121 | 93,313 | 243,434 | 4,015 | 27,159 | $1.00 | $0.00 | 7.11% | 9.03% | 0.00% | ||
| 1957/58 | 143,273 | 84,003 | 227,276 | 3,808 | 24,909 | $1.00 | $0.00 | 8.67% | 10.47% | |||
| 1956/57 | 135,666 | 73,485 | 209,151 | 3,518 | 22,549 | 8.13% | 9.34% | |||||
| 1955/56 | 125,457 | 67,973 | 193,430 | 3,555 | 20,623 | 10.96% | 11.86% | |||||
| 1954/55 | 111,336 | 62,982 | 174,318 | 3,213 | 18,437 | 11.78% | 12.09% | |||||
| 1953/54 | 98,535 | 57,411 | 155,946 | 2,891 | 16,449 | 10.68% | 15.17% | |||||
| 1952/53 | 88,962 | 51,934 | 140,896 | 2,665 | 14,282 | 8.14% | 7.23% | |||||
| 1951/52 | 81,722 | 48,568 | 130,290 | 2,480 | 13,319 | 13.90% | 12.29% | |||||
| 1950/51 | 70,348 | 44,044 | 114,392 | 2,507 | 11,861 | 9.68% | 7.12% | |||||
| 1949/50 | 63,669 | 40,623 | 104,292 | 2,315 | 11,073 | 6.40% | 12.42% | |||||
| 1948/49 | 58,449 | 39,574 | 98,023 | 2,157 | 9,850 | 7.24% | 6.34% | |||||
| 1947/48 | 52,631 | 38,778 | 91,409 | 1,893 | 9,263 | -1.91% | 3.45% | |||||
| 1946/47 | 52,044 | 41,141 | 93,185 | 1,977 | 8,954 | 5.25% | 5.45% | |||||
| 1945/46 | 47,800 | 40,738 | 88,538 | 1,765 | 8,491 | 2.69% | 12.97% | |||||
| 1944/45 | 44,783 | 41,437 | 86,220 | 1,109 | 7,516 | $0.50 | $0.00 | 0.98% | 11.36% | 0.00% | ||
| 1943/44 | 43,871 | 41,511 | 85,382 | 978 | 6,749 | $0.50 | $0.00 | 7.18% | 0.75% | |||
| 1942/43 | 40,883 | 38,776 | 79,659 | 852 | 6,699 | 1.36% | 4.48% | |||||
| 1941/42 | 39,351 | 39,238 | 78,589 | 1,005 | 6,412 | $0.50 | $0.00 | -5.40% | -8.35% | 0.00% | ||
| 1940/41 | 39,552 | 43,523 | 83,075 | 1,510 | 6,996 | $0.50 | $0.00 | -4.76% | -12.21% | 0.00% | ||
| 1939/40 | 40,353 | 46,875 | 87,228 | 2,588 | 7,969 | $0.50 | $0.00 | -5.04% | -4.43% | |||
| 1938/49 | 41,037 | 50,825 | 91,862 | 3,221 | 8,338 | 8.13% | 4.20% | |||||
| 1937/38 | 37,307 | 47,652 | 84,959 | 2,927 | 8,002 | 10.89% | 7.35% | |||||
| 1936/37 | 33,118 | 43,496 | 76,614 | 2,704 | 7,454 | 0.14% | 6.79% | |||||
| 1935/36 | 31,120 | 45,387 | 76,507 | 2,904 | 6,980 | $0.50 | $0.00 | 6.68% | 6.96% | 0.00% | ||
| 1934/35 | 29,084 | 42,630 | 71,714 | 2,898 | 6,526 | $0.50 | $0.00 | 23.03% | 25.45% | |||
| 1933/34 | 24,244 | 34,044 | 58,288 | 2,621 | 5,202 | 1.15% | 8.47% | |||||
| 1932/33 | 23,329 | 34,294 | 57,623 | 2,339 | 4,796 | 3.33% | 3.12% | |||||
| 1931/32 | 23,140 | 32,627 | 55,767 | 1,836 | 4,651 | 5.89% | 5.70% | |||||
| 1930/31 | 22,260 | 30,403 | 52,663 | 1,505 | 4,400 | 10.75% | 13.26% | |||||
| 1929/30 | 19,112 | 28,439 | 47,551 | 1,136 | 3,885 | 4.17% | -2.51% | |||||
| 1928/29 | 16,814 | 28,832 | 45,646 | 855 | 3,985 | -1.42% | 6.95% | |||||
| 1927/28 | 16,872 | 29,433 | 46,305 | 691 | 3,726 | 2.65% | 7.91% | |||||
| 1926/27 | 16,320 | 28,790 | 45,110 | 745 | 3,453 | 2.21% | 3.11% | |||||
| 1925/26 | 15,319 | 28,817 | 44,136 | 593 | 3,349 | 7.88% | 0.18% | |||||
| 1924/25 | 13,053 | 27,858 | 40,911 | 336 | 3,343 | 2.53% | 13.44% | |||||
| 1923/24 | 13,387 | 26,516 | 39,903 | 2,947 | -17.24% | 11.12% | ||||||
| 1922/23 | 13,762 | 34,454 | 48,216 | 2,652 | 6.67% | 5.15% | ||||||
| 1921/22 | 11,480 | 33,720 | 45,200 | 2,522 | 35.34% | 23.14% | ||||||
| 1920/21 | 6,343 | 27,055 | 33,398 | 36 | 2,048 | 23.80% | 24.27% | |||||
| 1919/20 | 4,288 | 22,690 | 26,978 | 1,648 | 14.19% | 3.71% | ||||||
| 1918/19 | 2,738 | 20,887 | 23,625 | 1,589 | 22.86% | 32.42% | ||||||
| 1917/18 | 1,806 | 17,423 | 19,229 | 1,200 | 4.50% | 12.89% | ||||||
| 1916/17 | 1,257 | 17,144 | 18,401 | 1,063 | 2.44% | 3.00% | ||||||
| 1915/16 | 421 | 17,542 | 17,963 | 1,032 | 9.91% | -4.80% | ||||||
| 1914/15 | 16,343 | 16,343 | 1,084 | 20.48% | 18.86% | |||||||
| 1913/14 | 13,565 | 13,565 | 912 | |||||||||